Learn how to use the TickXIQ Performance/Attendance Tracker to monitor timeslot sales, set custom thresholds, analyse attendance trends, and access detailed Single Performance insights. Understand forecasting, historical comparisons, and data-driven tools to optimise attendance and revenue.
How IQ Attendance Tracker in IQ Works
The Performance/Attendance Tracker in TickXIQ is a dynamic tool that enables partners to monitor and manage attendance for each timeslot/ performance of their attractions. This guide will help you understand how to use the tracker effectively to stay on top of ticket sales, set thresholds, and optimise performance using advanced analytics.
Overview of the Performance/Attendance Tracker
The Performance/Attendance Tracker allows you to view each timeslot's performance, set custom thresholds to determine when attention is required, and access a detailed Single Performance View. This functionality helps you make data-driven decisions to maximise attendance and revenue.
Key Features and How to Use Them
Attendance Tracker Grid View
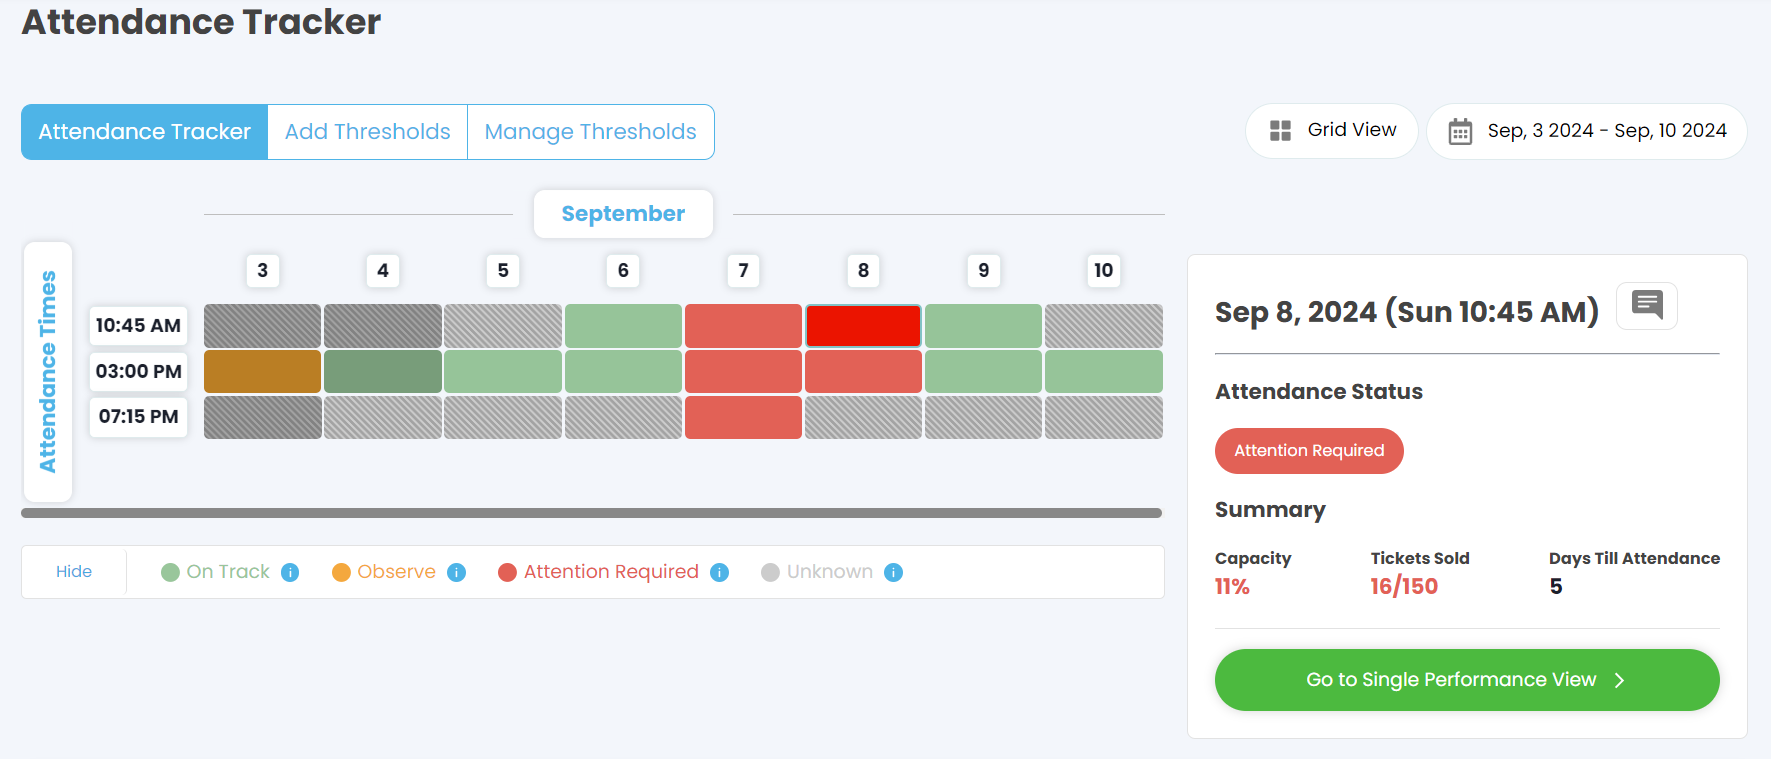
- The Attendance Tracker grid provides an overview of all scheduled timeslots for your attractions over a specified period. Each timeslot is colour-coded to indicate its status:
- Green (On Track): Sales are progressing as expected.
- Orange (Observe): Sales are below expectations but not critical.
- Red (Attention Required): Sales are significantly below target, and immediate action may be needed.
- Grey (Unknown): No data or sales trends have been established yet.
- How to Use:
- Use the grid to quickly identify which timeslots require attention and which are performing well. Click on any timeslot to view its details in the Single Performance View.
Add and Manage Thresholds
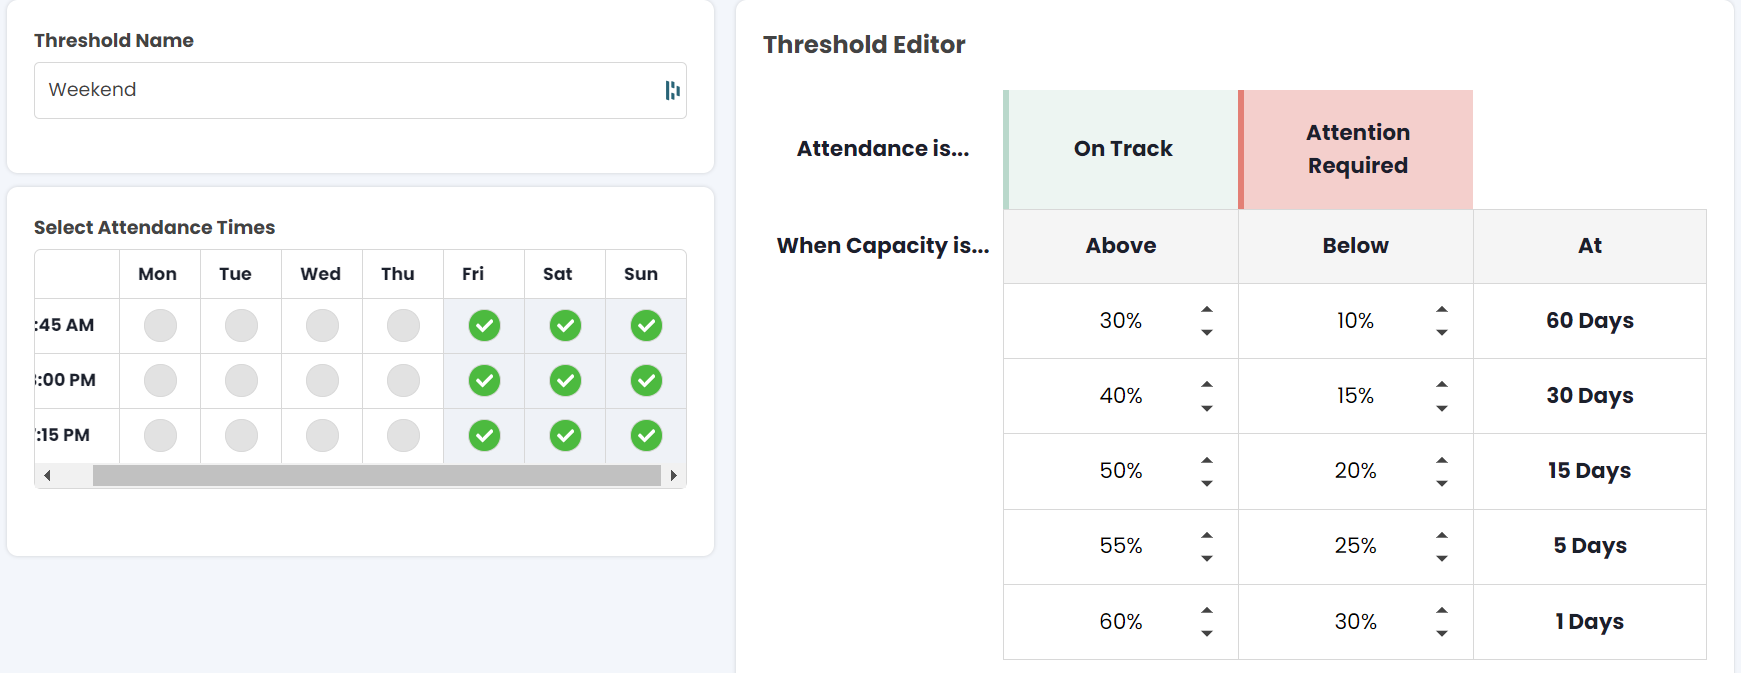
- The tracker allows you to set and manage thresholds that define what qualifies as “On Track,” “Observe,” or “Attention Required.” These thresholds are based on the percentage of tickets sold relative to the number of days remaining until the event.
- How to Use:
- Click on the Add Thresholds or Manage Thresholds tabs to customise thresholds according to your business needs. Adjust thresholds based on historical performance, expected demand, or other criteria to stay proactive in managing attendance.
Single Performance View
-
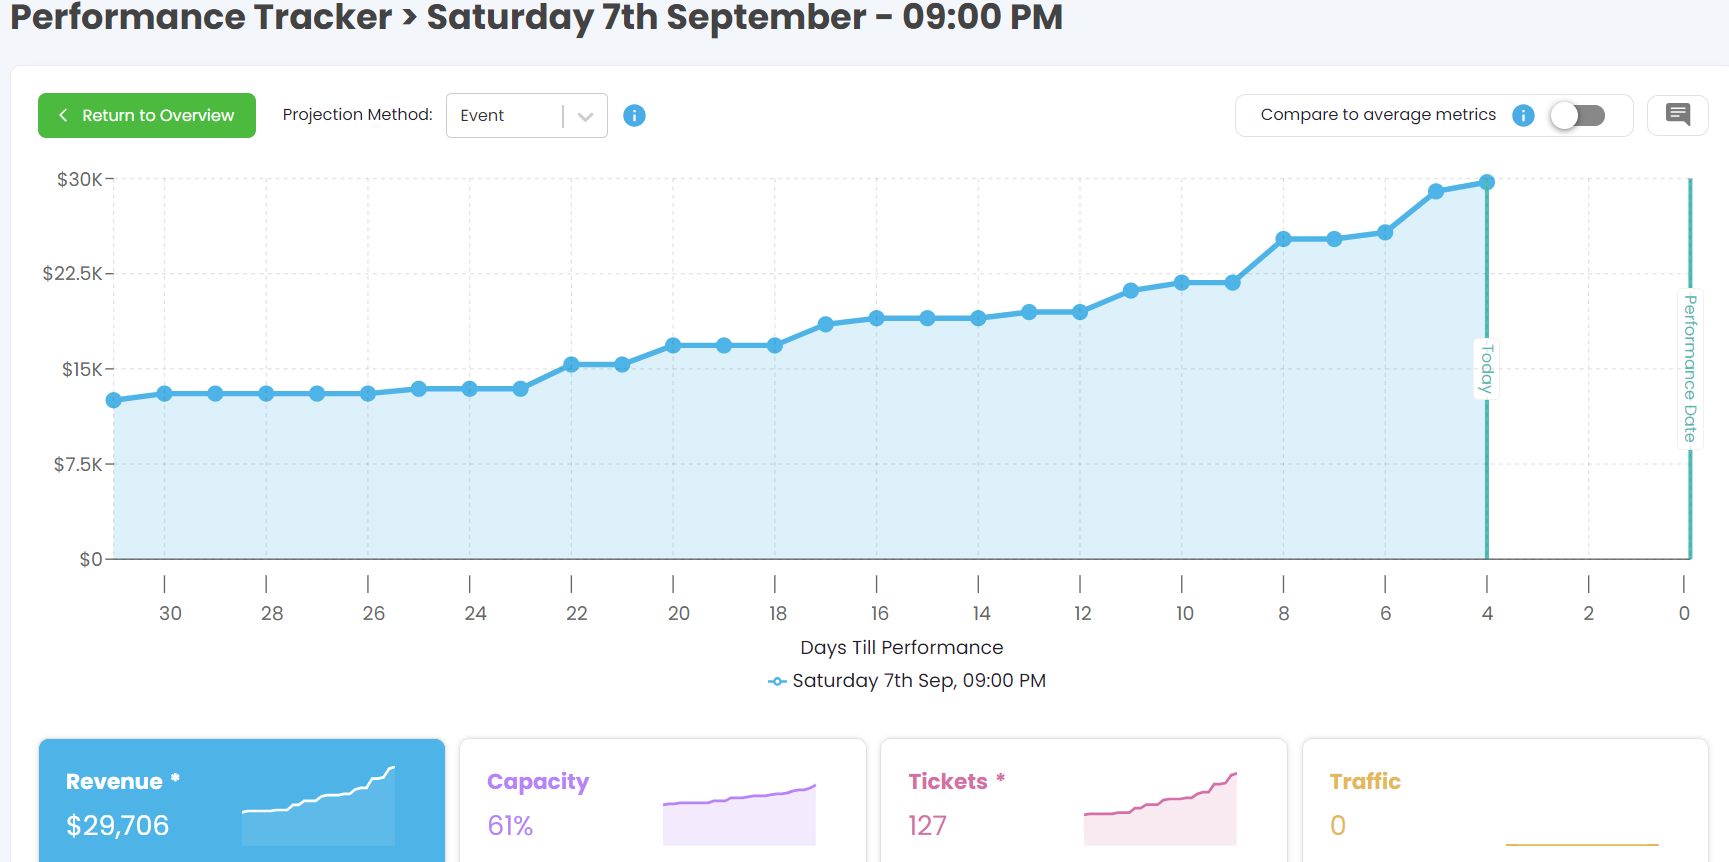
- Clicking on a specific timeslot in the grid takes you to the Single Performance View. This view provides a detailed analysis of sales trends leading up to the performance, including:
- A graph showing revenue and ticket sales over time.
- Projections for final sales using Meta's forecasting algorithm.
- Comparison against historical averages for the same day of the week and timeslot.
- How to Use:
- Use the sales trend graph to monitor the progress of ticket sales and gauge whether the timeslot is performing as expected. Leverage the forecasting feature to predict final sales and make adjustments to your marketing or sales strategies as needed.
- Clicking on a specific timeslot in the grid takes you to the Single Performance View. This view provides a detailed analysis of sales trends leading up to the performance, including:
-
Comparison Against Historical Performance
- The Single Performance View also enables you to compare the current timeslot’s performance against historical averages for the same day and time. This helps you understand whether the timeslot is on track or underperforming.
- How to Use:
- Toggle the “Compare to Average Metrics” option to view historical data and identify patterns or trends. Use this information to adjust pricing, promotions, or other factors to enhance sales.
-
Detailed Sales Insights
- The Single Performance View provides additional insights into:
- Hours of the Day: When customers are buying tickets.
- Group Sizes: The average number of tickets per order.
- Purchase Flows: The paths customers take to complete a purchase.
- Ticket Types: Distribution of different types of tickets sold.
- How to Use:
- Compare these metrics against historical averages to determine if any adjustments are necessary. For example, if most sales are happening during specific hours, consider targeting those times with promotional offers.
- The Single Performance View provides additional insights into:
Benefits of Using the Performance/Attendance Tracker
- Proactive Management: Stay ahead of potential issues by identifying timeslots that require attention well in advance.
- Data-Driven Decisions: Use real-time data and historical comparisons to make informed decisions about marketing, pricing, and resource allocation.
- Optimise Sales Strategies: Adjust your approach based on actual sales trends and forecasts to maximise attendance and revenue for each timeslot.