This article explains how the Attendance Day/Time and Days Till Attendance sections of the TickX IQ platform provide insights into when customers attend and how far in advance they book. It covers how to interpret the heat-mapped day/time breakdown, identify peak attendance periods, and optimise staffing or marketing activity. It also details how Days Till Attendance metrics reveal booking lead-time patterns, including median booking windows and distribution across key time ranges. This guide helps users make data-driven decisions for scheduling, forecasting demand, and improving customer engagement.
Getting Started
The "Attendance Day/Time" and "Days Till Attendance" sections of your TickX IQ platform provide valuable insights into customer behaviour patterns, helping you optimise marketing strategies, event planning, and resource allocation. Here’s a breakdown of what each section represents and how you can use them to your advantage.
Attendance Day/Time Metrics
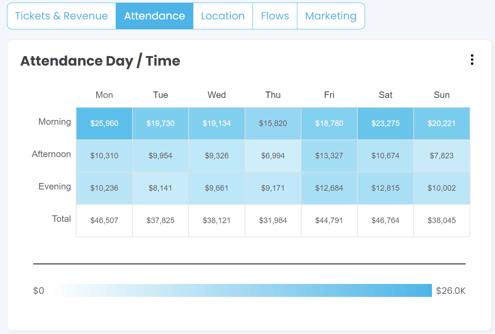
The "Attendance Day/Time" chart visually represents the distribution of timeslots and sales revenue across different days of the week and times of the day (morning, afternoon, and evening). This section is broken down into:
- Days of the Week: The chart displays data for each day of the week, allowing you to identify which days see the highest or lowest attendance and revenue.
- Time of Day Segments: The attendance data is further divided into three segments: morning, afternoon, and evening. This helps you understand when your customers are most active during the day.
How to Use These Metrics:
- Identify Peak Periods: Use the data to determine which days and times see the most significant attendance. This can help you decide when to schedule key events or promotions.
- Optimise Staffing and Resources: By understanding when your customers are most active, you can allocate resources more effectively, such as increasing staff during peak times or offering promotions during quieter periods.
- Tailor Marketing Campaigns: Target your marketing efforts around the days and times when customer engagement is highest to maximise attendance and revenue.
Days Till Attendance Metrics
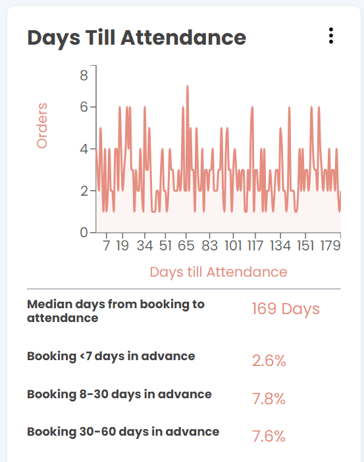
The "Days Till Attendance" section provides insights into booking behaviour by showing the number of days between when a booking is made and the actual attendance date. The data is presented in two formats:
- Line Chart: Displays the distribution of orders over different booking lead times, showing trends in how far in advance customers typically book.
- Key Metrics Summary: Highlights critical metrics such as the median number of days from booking to attendance and the percentage of bookings made within various time frames (e.g., less than 7 days, 8-30 days, etc.).
How to Use These Metrics:
- Understand Booking Patterns: Use these insights to gauge how far in advance your customers tend to book. This can help you plan marketing campaigns, special offers, and reminders at optimal times to encourage earlier bookings.
- Improve Customer Engagement: Knowing typical booking windows allows you to send targeted communication, such as last-minute promotions for those booking closer to the attendance date or early-bird discounts to encourage advance bookings.
For guides to other Analytics areas within the TickXIQ Platform, please see below:
- Sales Reporting - Tickets & Revenue
- Sales Reporting - Location
- Sales Reporting - Flows
- Sales Reporting - Marketing