This guide explains how to use the Sign-Up and Surveys Analytics tools in TickX IQ to understand how customers interact with your surveys and sign-up forms. You can view detailed question responses, filter results by individual survey widgets, explore customer locations on an interactive map, and link every response to downstream transactions. The tool also tracks conversions and revenue generated from sign-ups and surveys, helping you measure attribution and the effectiveness of your marketing. Annotations allow teams to highlight insights and key trends for ongoing analysis.
This tool provides insights into how your customers are interacting with your sign-up forms and surveys, enabling you to gain a deeper understanding of your customer base and improve your marketing efforts.
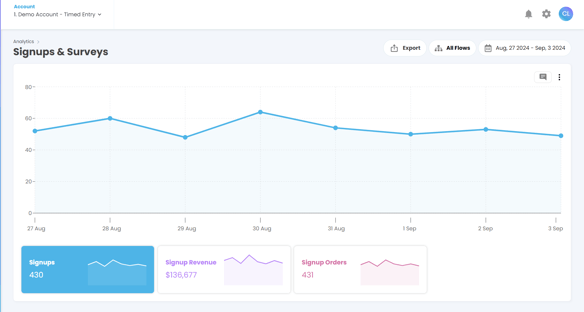
Overview
The Sign-Up and Surveys Analytics functionality allows you to view detailed responses to each individual sign-up and survey set up in your TickX IQ account. You can analyse customer behaviour, understand marketing attribution, and track conversions and revenue generated from each sign-up or survey.
You can read more about how to create new Sign Up & Post Purchase Surveys here!
Key Features
View Detailed Survey Responses
- You can see the answers to every question in your surveys. This includes data such as:
-
- How customers heard about your attraction.
- Who they are attending with.
- Their location or where they are staying.
- Anything you've included in your post purchase surveys
-
- These insights help you understand your customers better and improve your marketing attribution by identifying which channels are driving traffic to your attraction.
Analyse Responses by Each Survey Widget
- Use the filters to show results from each of your post purchase surveys, or sign up widgets.
- This allows you to see detailed answers to each question and understand how different groups of customers are engaging with your content.
Customer Location Map
- Use the interactive customer location map to visualise where your survey respondents and sign-ups are coming from globally.
- The map provides an easy-to-understand view of geographical data, helping you identify key markets and areas with higher customer interest or engagement.
Link Survey Responses to Transactions
- The functionality allows you to connect every sign-up or survey response to transactions. This means you can track:
- The date of every customer email sign-up.
- How many of those sign-ups have converted into purchases.
- The total revenue generated from each conversion.
Annotations Functionality
- The analytics tool includes an Annotations feature, allowing you to add notes or highlights directly within the data.
- Use annotations to mark significant trends, insights, or any data points that require special attention. This feature is useful for team collaboration and future reference when revisiting the data.