The Web Analytics Platform in TickX IQ provides detailed insights into customer behaviour on your website, allowing you to track conversion trends, analyse the sales funnel, and understand traffic sources. This guide will help you navigate the platform's main functionalities, including date comparison, advanced filtering, and funnel analytics, to optimise your web performance and marketing strategies.
Conversion Trends
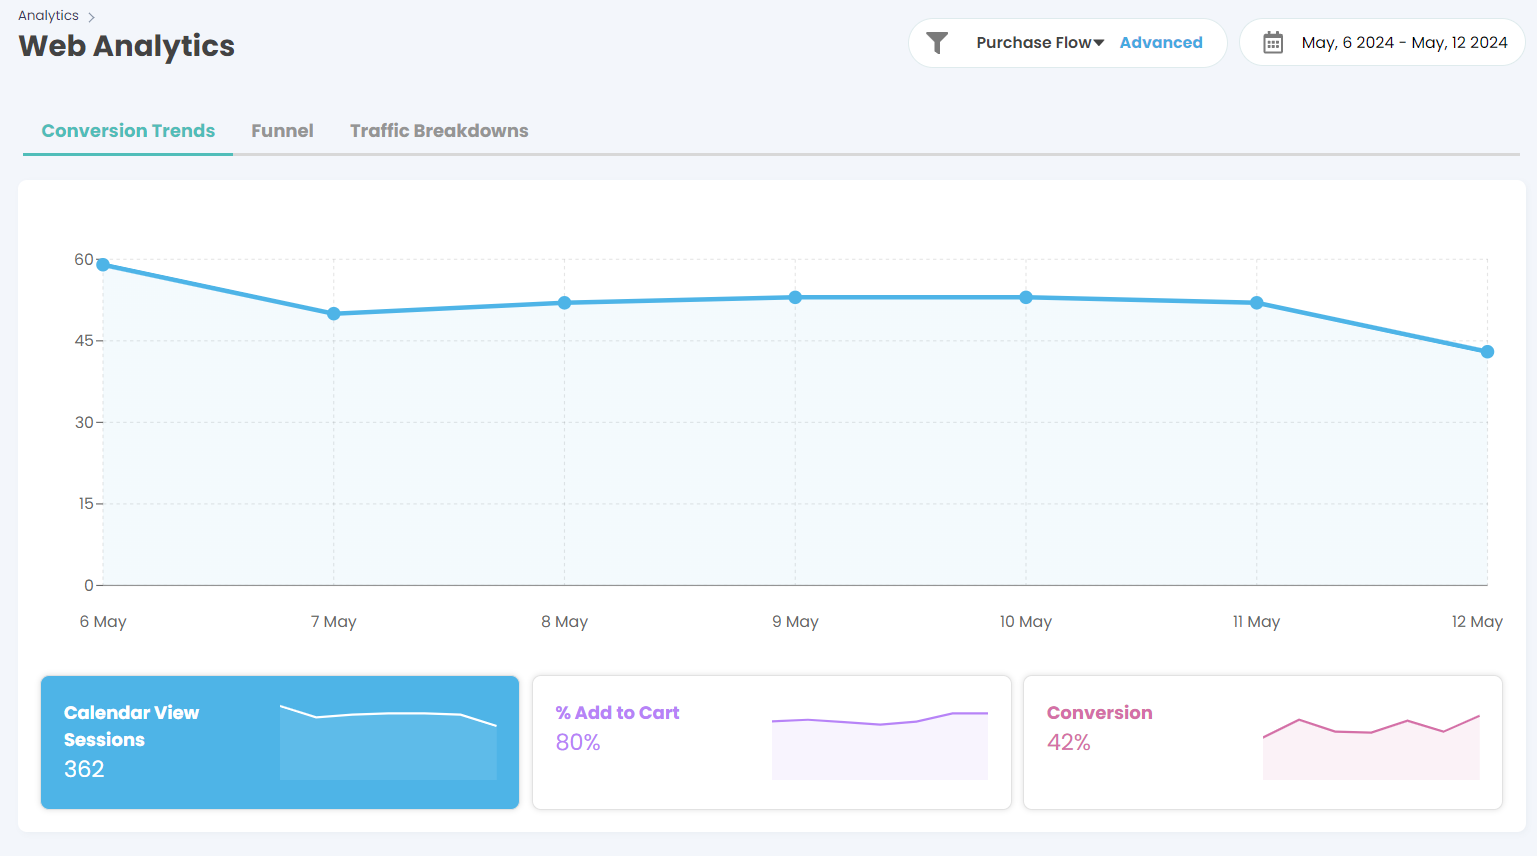
- The Conversion Trends tab offers a visual representation of your website’s performance over time, showing key metrics such as:
- Calendar View Sessions: The number of sessions where customers viewed the calendar on your site.
- % Add to Cart: The percentage of sessions that resulted in items being added to the cart.
- Conversion Rate: The percentage of sessions that resulted in a purchase.
- How to Use:
Use these metrics to track overall website performance, identify trends, and detect any sudden changes in customer behaviour. Compare different date ranges to understand how marketing campaigns, promotions, or other factors impact conversions.
Funnel Analytics
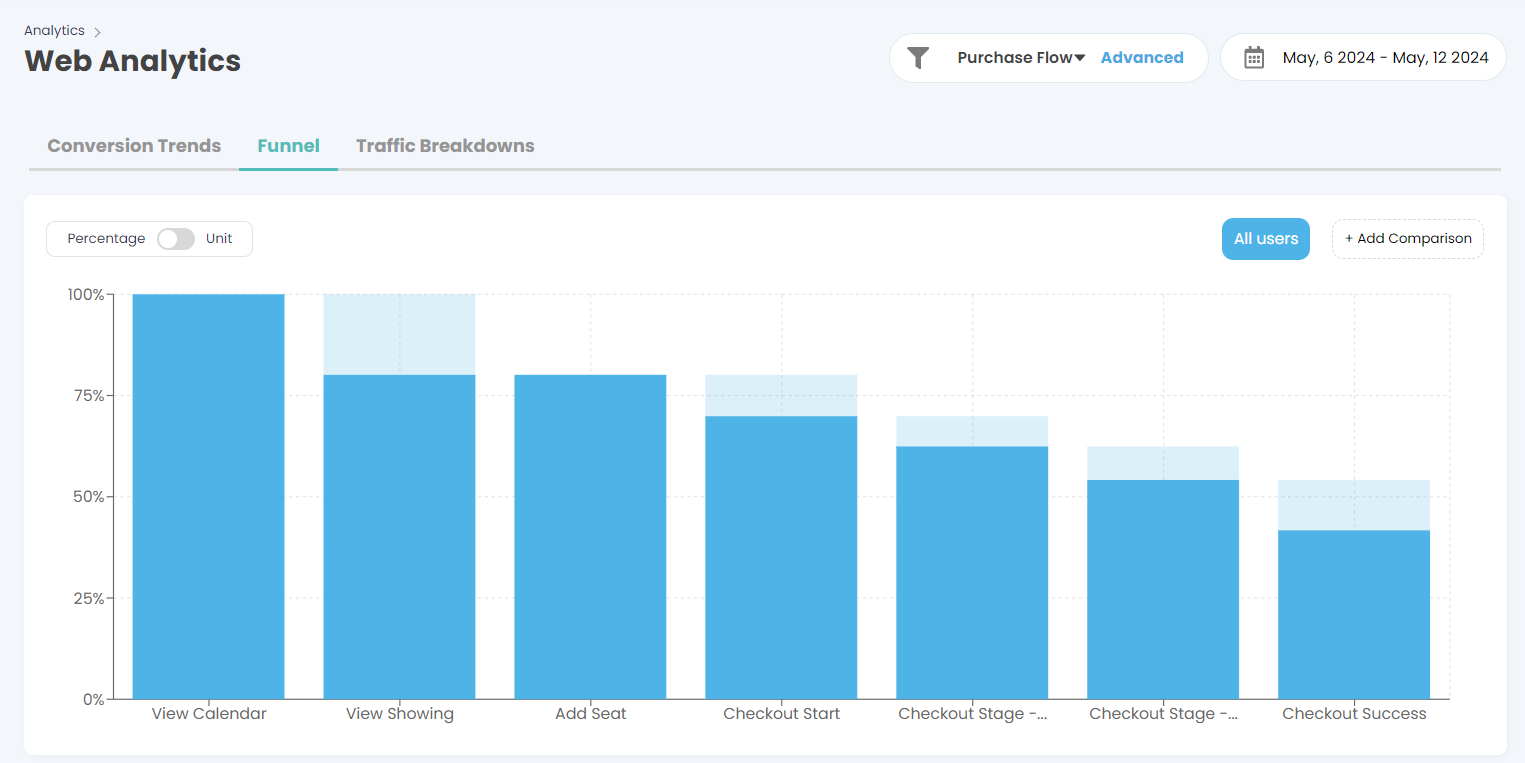
- The Funnel tab provides a detailed analysis of the customer journey from the initial website visit to the successful checkout. It shows the steps customers take, such as:
- View Calendar, View Showing, Add Seat, Checkout Start, Checkout Stages, and Checkout Success.
- These can be fully customised to your purchase flows, just speak to your account manager to adjust these steps.
- The funnel visualisation allows you to see at which steps customers are dropping off.
- How to Use:
- Compare and Contrast: You can compare different purchase flows, price ranges, promo codes, and UTM parameters to identify where customers are exiting the funnel. This insight helps pinpoint areas for improvement to reduce abandonment rates and increase conversions.
- Date Comparison and Filtering: Just like in the sales reporting section, you can use date comparison functionality and advanced filters to narrow down the data to specific periods, purchase flows, or customer segments.
Funnel Breakdown by Device and Step
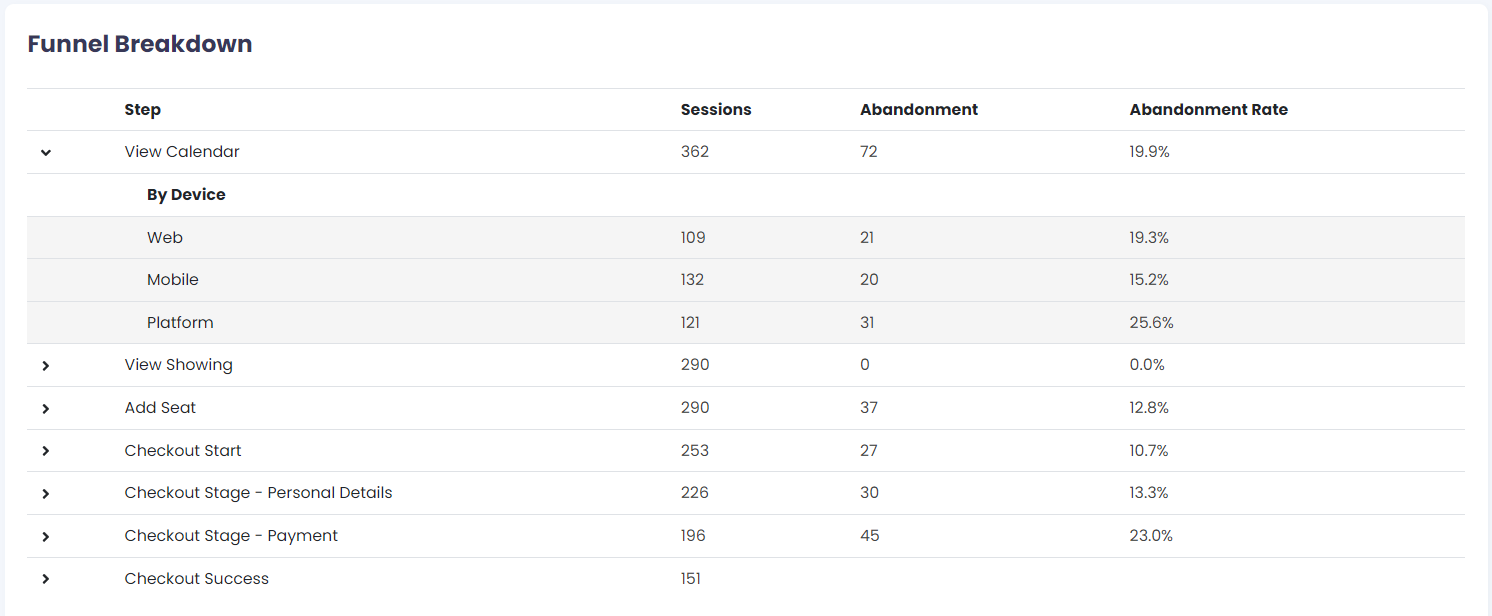
- The Funnel Breakdown table provides a step-by-step view of the user journey, along with data on sessions, abandonment, and abandonment rate. It also breaks down performance by device type (Web, Mobile, Platform).
- How to Use:
- Analyse Abandonment by Step and Device: Use this breakdown to understand at which steps and on which devices customers are most likely to drop off. This can help you optimise the website for different devices or target specific stages of the funnel for improvement.
Traffic Breakdowns
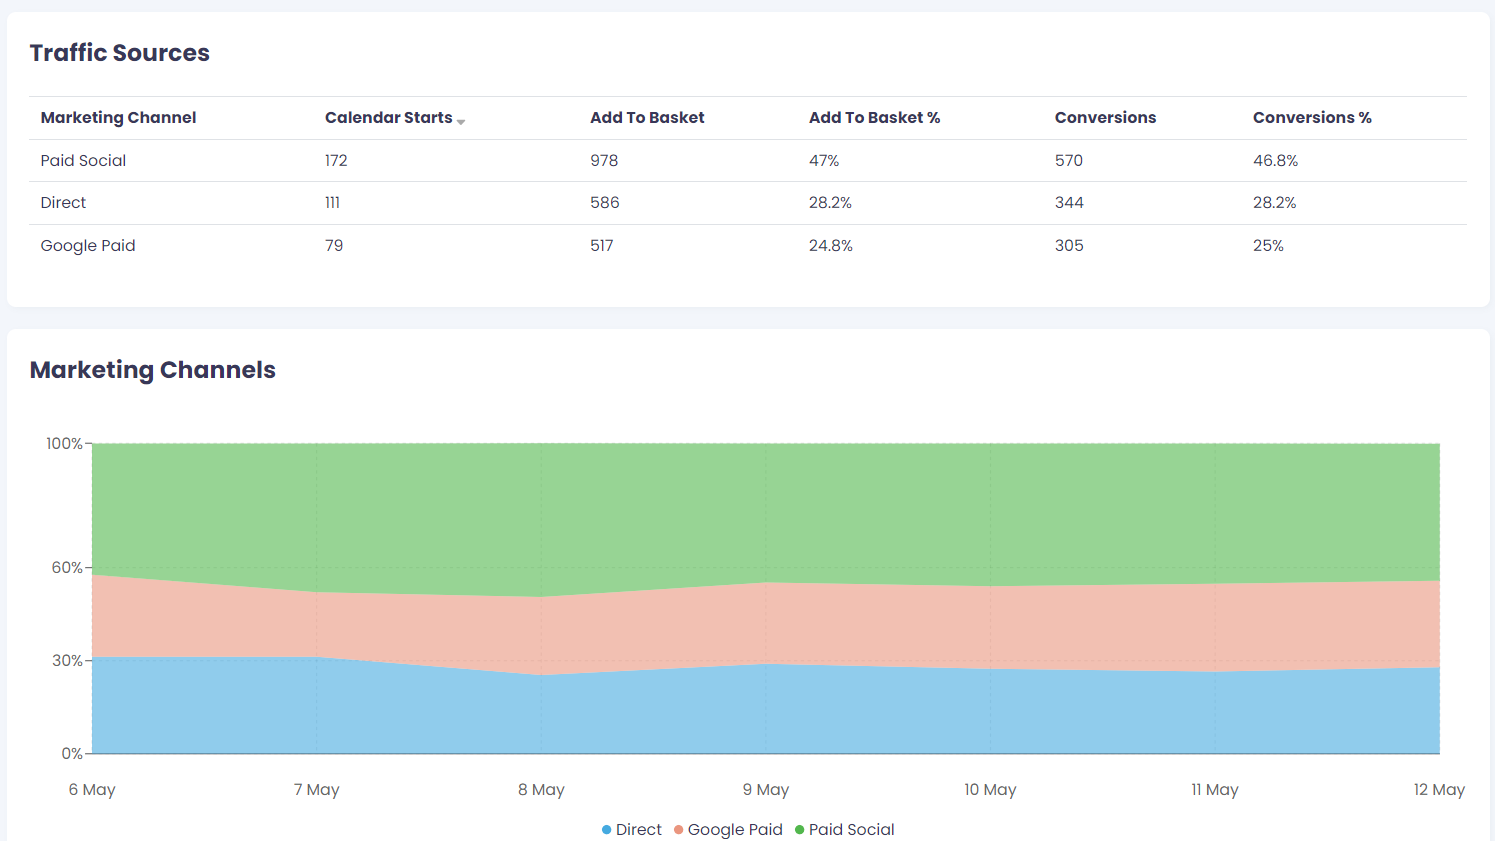
- The Traffic Breakdowns tab offers insights into the sources of your website traffic, broken down by Marketing Channel (e.g., Paid Social, Direct, Google Paid).
- It provides metrics such as Calendar Starts, Add to Basket, Add to Basket %, Conversions, and Conversion %.
- How to Use:
- Identify which marketing channels are driving the most traffic, basket additions, and conversions. This can inform where to focus your marketing efforts or allocate budget for maximum ROI.
Platform and Operating System Analysis
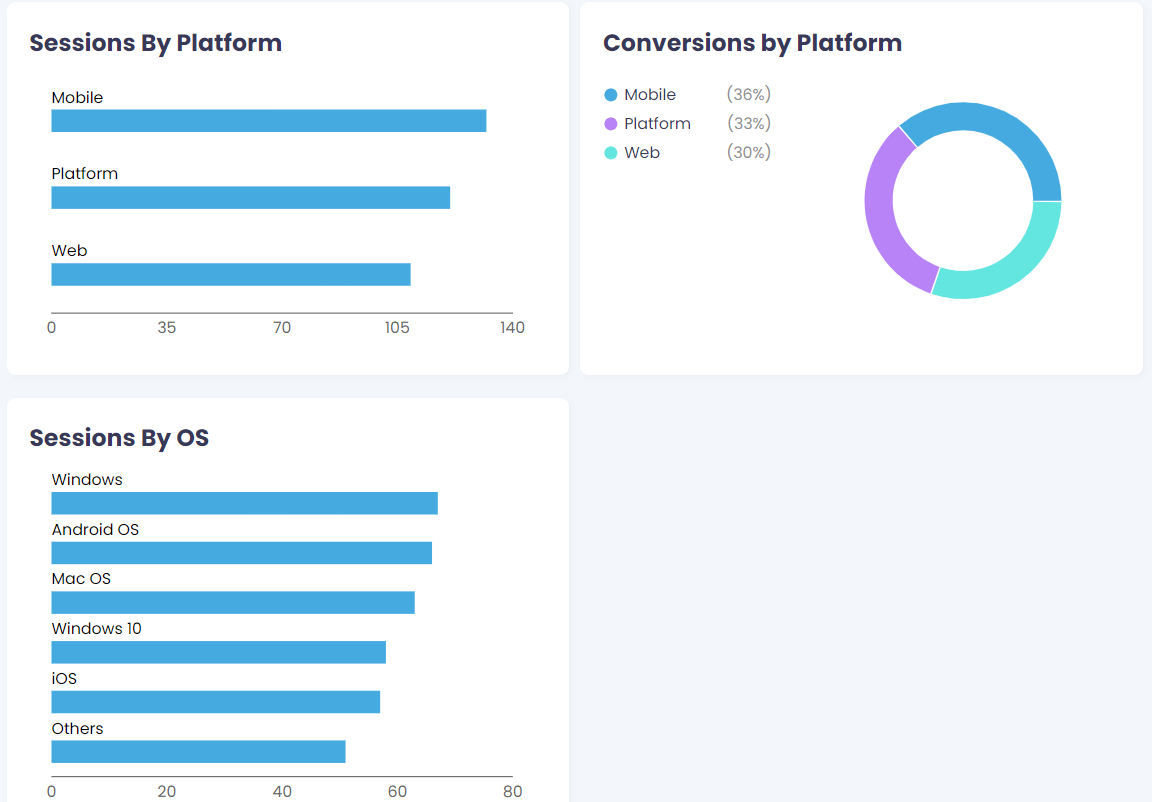
- The platform provides a detailed breakdown of sessions and conversions by platform (e.g., Mobile, Web) and by operating system (e.g., Windows, iOS).
- How to Use:
- Use this data to understand how different platforms and operating systems impact user behaviour.
Using Date Comparison and Filter Functionality
-
Date Comparison:
Use the date selector at the top right of the page to compare performance over different periods. This can help you measure the impact of specific campaigns or seasonal trends. -
Advanced Filters:
Apply filters to analyse specific segments, such as by purchase flow, price range, promo codes, or UTM parameters. Filtering allows you to drill down into the data that matters most, giving you a more targeted view of customer behaviour.
Leveraging Insights from Web Analytics
- Optimise Conversion Paths: Use funnel analytics to identify weak points in the customer journey and take steps to optimise those areas, reducing drop-offs and improving conversion rates.
- Tailor Marketing Strategies: Analyse traffic breakdowns to determine which channels, platforms, or devices are most effective, allowing you to tailor your marketing strategies accordingly.
- Enhance User Experience: Use the platform and operating system analysis to ensure that your website performs well across all devices and operating systems, providing a seamless experience for all users.